Getting started
You can use VentMapp3r through the graphical user interface (GUI) or command line:
For GUI
To start the GUI, type
ventmapper
A GUI that looks like the image below should appear. You can hover any of buttons in the GUI to see a brief description of the command.
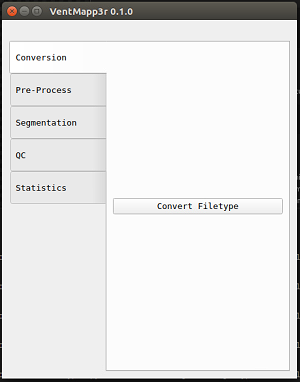 Graphical user interface for the VentMapper application
You can get the command usage info by click the “Help” box on any of the pop-up windows.
 Help screen for graphical user interface for Dasher application
For Command Line
You can see all the ventmapper commands by typing either of the following lines:
ventmapper -h
ventmapper --help
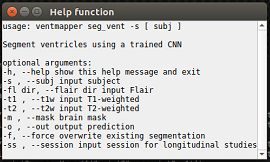
Once you know the command you want to know from the list, you can see more information about the command. For example, to learn more about seg_hfb:
ventmapper seg_vent -h
ventmapper seg_vent --help
Ventricular volumes
To extract ventricular volumes use the GUI (Stats/ventricular Volumes) or command line:
ventmapper stats_vent -h
QC
QC files are automatically generated in a sub-folder within the subject folder. They are .png images that show a series of slices in the brain to help you quickly evaluate if your command worked successfully, especially if you have run multiple subjects. They can also be created through the GUI or command line:
ventmapper seg_qc -h
The QC image should look like this:
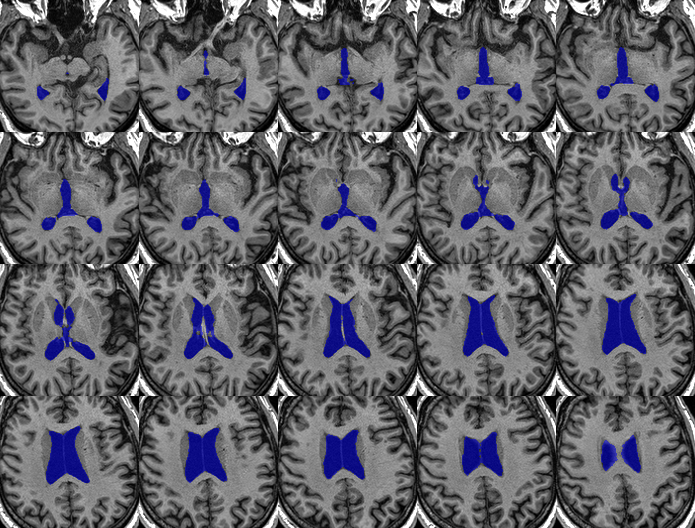 Quality control imagefor ventricular segmentation
Logs
Log files are automatically generated in a sub-folder within the subject folder. They are .txt files that contain information regarding the command and can be useful if something did not work successfully.
File conversion
To convert from one filetype to another (namely Analyze to Nifti, or vice versa)
ventmapper filetype

Required arguments:
-i , --in_img    input image, ex:MM.img
-o , --out_img   output image, ex:MM.nii

Example:
ventmapper filetype --in_img subject_T1.img --out_img subject_T1.nii.gz